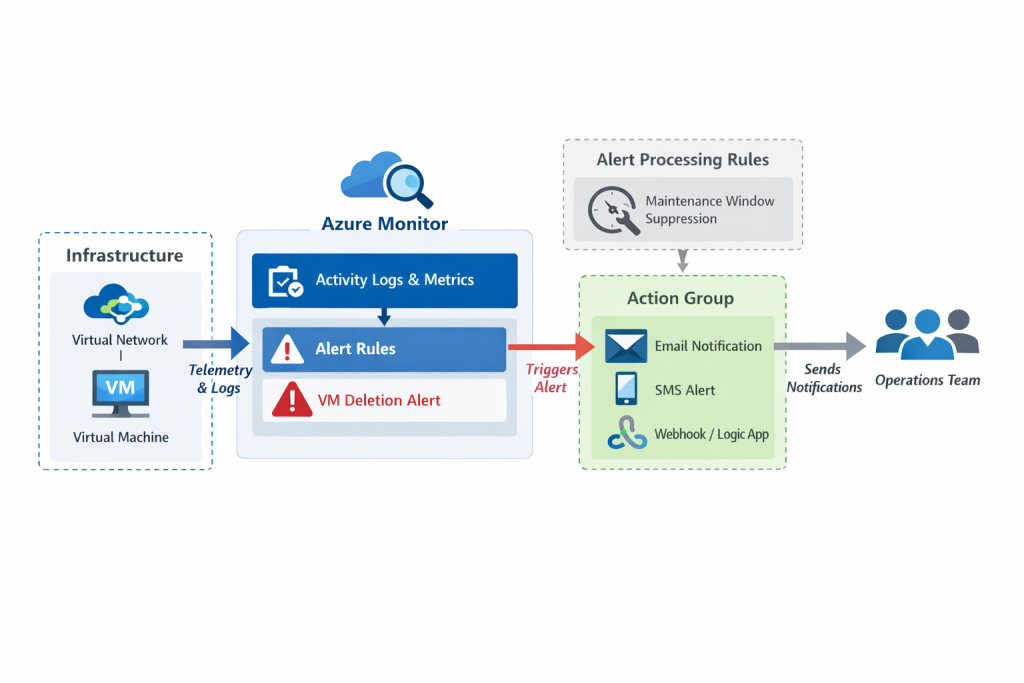
Modern cloud environments generate constant signals, metrics, logs, and events. Without proactive monitoring, critical changes such as accidental VM deletion can go unnoticed. Azure Monitor provides a centralized platform for collecting, analyzing, and acting on telemetry from Azure resources.
This tutorial will walk you through a realistic enterprise monitoring scenario, focusing on detection, notification, and alert noise reduction.
Architecture Overview
What Is Azure Monitor?
Azure Monitor is a unified monitoring service that provides end‑to‑end visibility into the performance, health, and reliability of your applications and infrastructure. It collects telemetry from Azure resources, on‑premises systems, and other cloud environments, and it centralizes this data so it can be analyzed, visualized, and acted upon.
Purpose of Azure Monitor
The primary goal of Azure Monitor is to help organizations maintain high availability and optimal performance. It enables administrators and operations teams to:
- Detect issues before they impact users
- Understand how applications and services are behaving
- Investigate the root cause of performance or reliability problems
- Automate responses to critical events
By consolidating monitoring data into a single platform, Azure Monitor reduces complexity and improves operational efficiency.
How Azure Monitor Works
1. Data Collection
Azure Monitor gathers telemetry from multiple layers of your environment, including:
- Application telemetry (requests, dependencies, exceptions)
- Operating system metrics (CPU, memory, disk)
- Azure resource logs and metrics
- Network performance data
- Custom logs and metrics
- On‑premises and multi‑cloud systems
This data is collected from one or more Azure subscriptions and tenants, allowing organizations with distributed environments to centralize their monitoring strategy.
2. Unified Data Platform
All collected telemetry is stored in a common data platform. This unified storage model allows different Azure Monitor features and tools to work together seamlessly.
Examples include:
- Metrics Explorer for real‑time performance analysis
- Log Analytics for querying and correlating log data
- Workbooks for interactive dashboards
- Alerts for automated detection and notification
- Insights for resource‑specific monitoring (VMs, containers, databases)
Because everything is stored in a consistent format, you can correlate events across systems and quickly identify patterns or anomalies.
3. Analysis and Visualization
Azure Monitor provides several tools to help you interpret the collected data:
- Dashboards for high‑level visibility
- Workbooks for detailed reporting
- Insights for curated visualizations
- Kusto Query Language (KQL) for advanced analysis
These tools help you answer operational questions such as
- Is my application responding slowly?
- What caused this spike in CPU usage?
- Are there any failing components in my environment?
4. Automated Response and Integration
Azure Monitor supports both manual and automated responses to events. You can:
- Trigger alerts when conditions are met
- Notify teams using action groups (email, SMS, webhook, ITSM)
- Apply processing rules to suppress or modify alerts
- Automate remediation using Logic Apps, Azure Functions, or Automation Runbooks
- Stream data to external platforms such as Microsoft Sentinel, Splunk, Elastic, or other SIEM/SOAR tools
This ensures that critical issues are addressed quickly and consistently.
Provisioning Infrastructure Using an ARM Template
Infrastructure as Code (IaC) ensures deployments are repeatable and auditable. In this lab tutorial, an ARM template is used to deploy:
-
A virtual network
-
A virtual machine
ARM templates are JSON files processed by Azure Resource Manager, enabling consistent infrastructure deployment across environments.
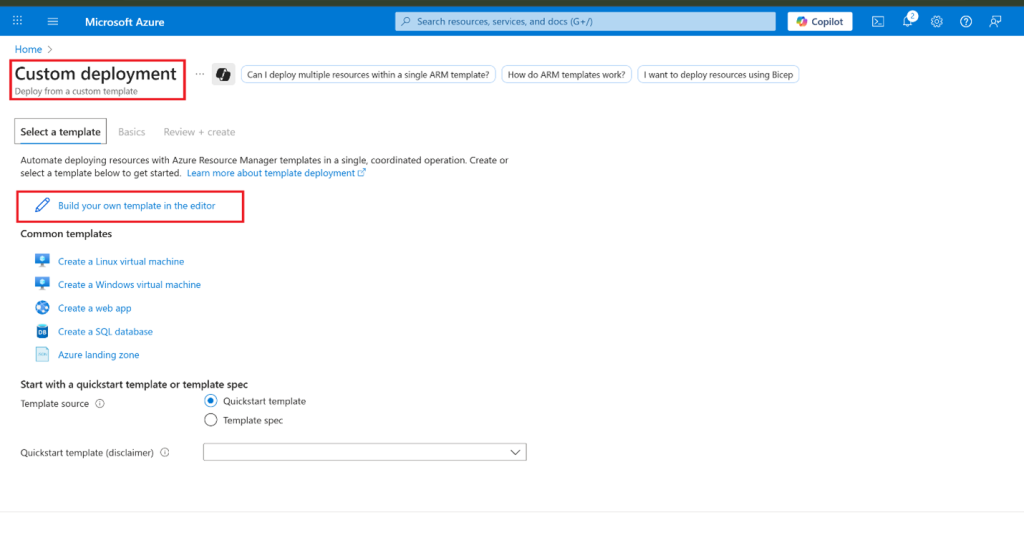
- Sign in to the Azure portal
- From the Azure portal, search for and select Deploy a custom template.
- On the custom deployment page, select Build your own template in the editor.
- On the edit template page, select Load file.
- Locate and select the ARM template.json file, then select Open and Save.

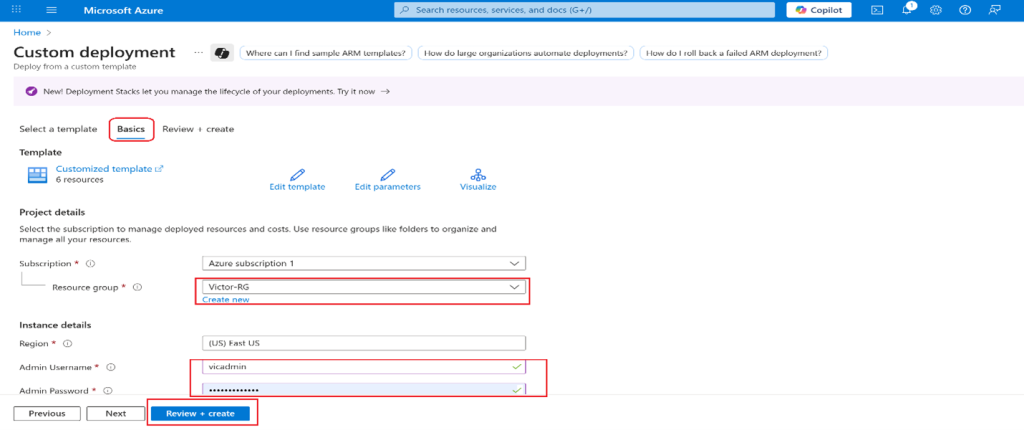
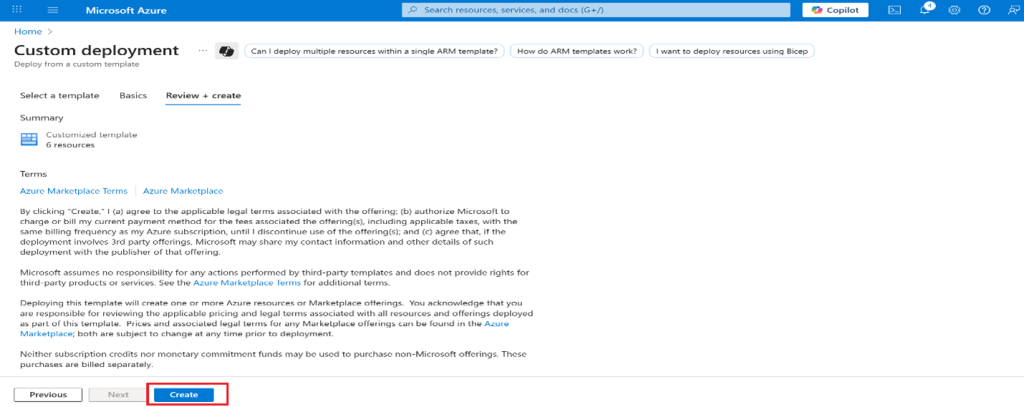
- Wait for the deployment to be finished, then click Go to resource group.
- Review what resources were deployed. There should be one virtual network with one virtual machine.

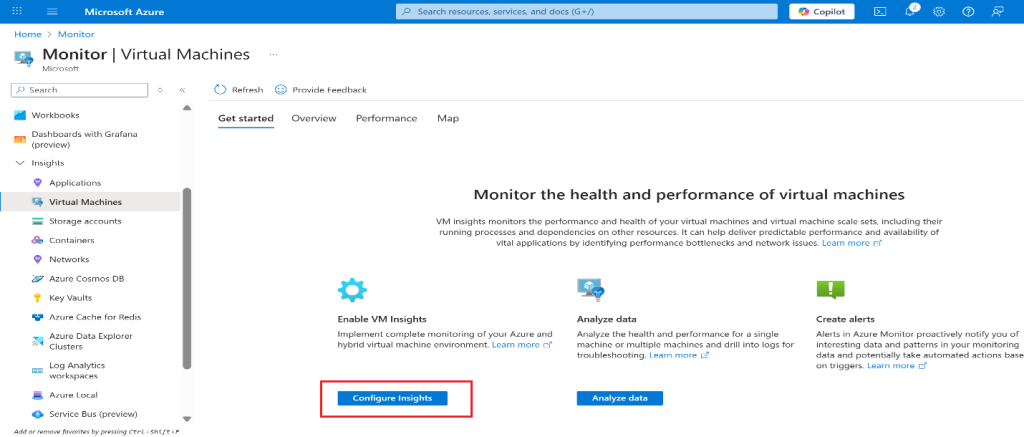
Configure and Enable Azure Monitor and VM Insights
Once the VM is deployed, Azure Monitor must be enabled to collect telemetry.
VM Insights installs the Azure Monitor Agent (AMA), which:
-
Sends performance data to Azure Monitor
-
Collects guest-level metrics and dependencies
This step ensures the VM is observable beyond basic infrastructure metrics.
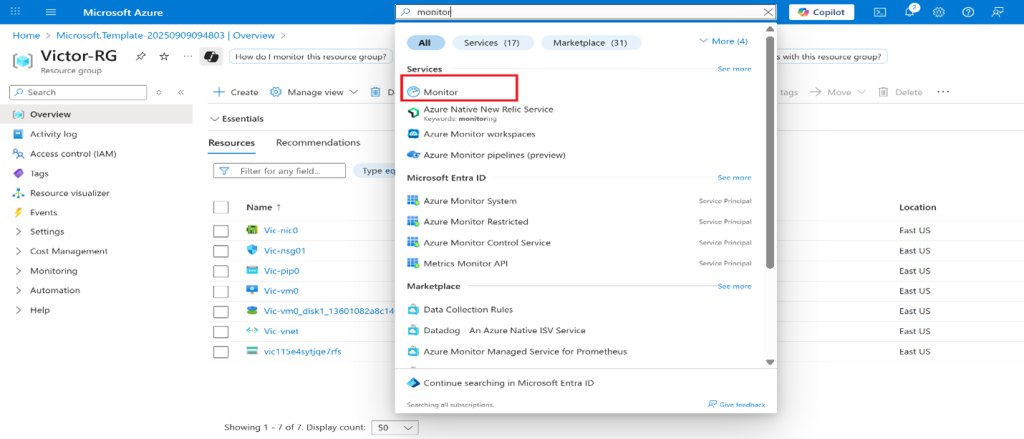
- In the portal, search for and select Monitor.
- Take a minute to review all the insights, detection, triage, and diagnosis tools that are available.
- Select View in the VM Insights box, and then select Configure Insights.
- Select Enable next to your virtual machine and then Enable on the Azure Monitor – Insights Onboarding


- Take the defaults for subscription and data collection rules, then select
Note: It will take a few minutes for the virtual machine agent to install and configure.

Create an alert
You create an alert for when a virtual machine is deleted.
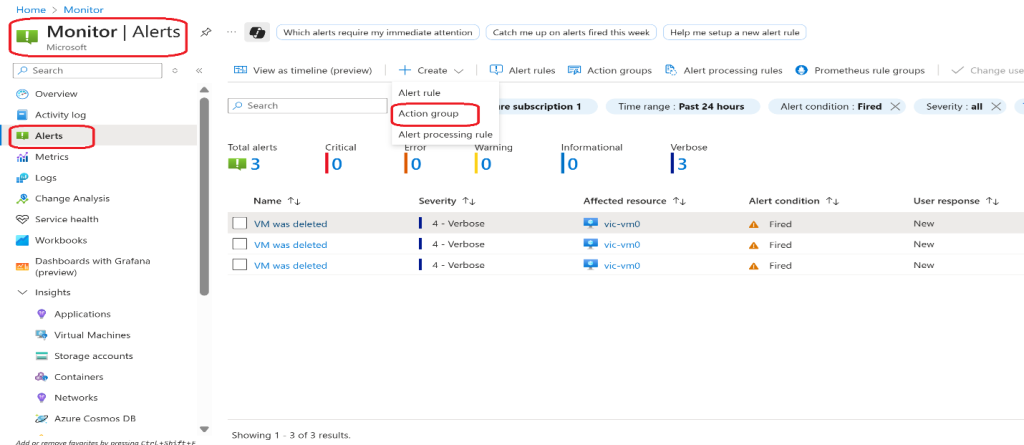
- Continue on the Monitor page, select Alerts
- Select Create + and select Alert rule.

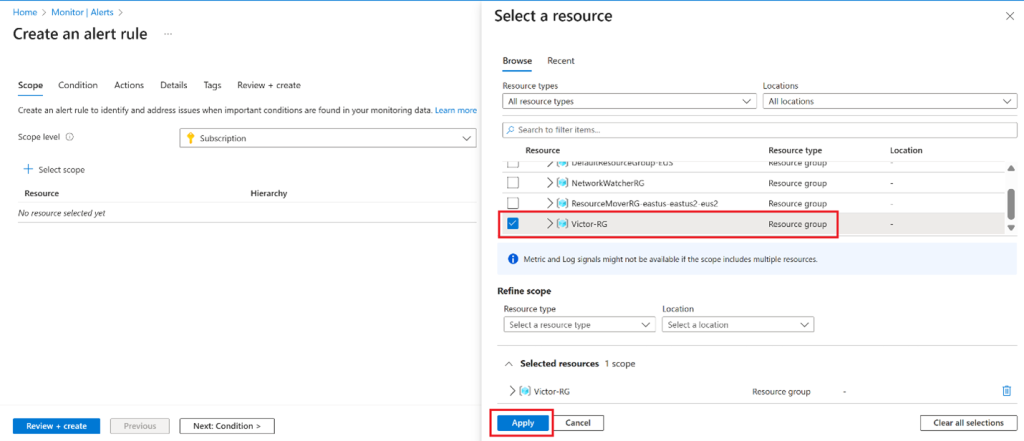
- Select the box for the subscription, then select Apply. This alert will apply to any virtual machines in the subscription.

- Select the Condition tab and then select the See all signals
- Search for and select Delete Virtual Machine (Virtual Machines). Notice the other built-in signals. Select Apply
- In the Alert logic area (scroll down), review the Event level Leave the default of All selected.
- Review the Status Leave the default of All selected.
- Leave the Create an alert rule pane open for the next task.


Creating an Azure Monitor Alert for VM Deletion
Azure Monitor supports Activity Log alerts, which are ideal for tracking control-plane events.
In this tutorial:
-
The signal “Delete Virtual Machine” is selected.
-
The scope is set at the subscription level.
-
The alert triggers when a VM deletion event occurs.
This type of alert is commonly used for security and governance monitoring.
If the alert is triggered, send an email notification to the operations team.
- Select Use action groups, then select Create action group in the Select action group
NOTE: Did you know? You can add up to five action groups to an alert rule. Action groups are executed concurrently, in no specific order. Multiple alert rules can use the same action group.
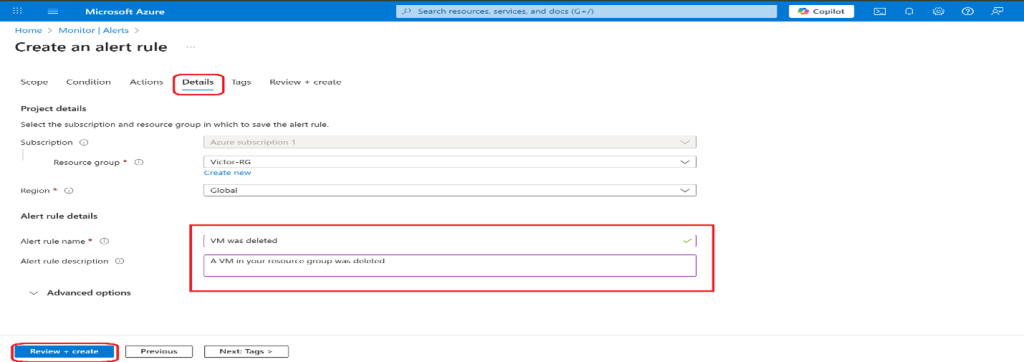
- On the Basics tab, enter the values for each setting

- Select Next: Notifications and enter the values for each setting.
- Select Email, and in the Emailbox, enter your email address, and then select OK.

- Select Review + Create and then Create.
- Once the action group is created, move to the Next: Detailstab and enter the values for each setting.
Trigger an alert and confirm it is working
Validation confirms that monitoring works as expected.
By deleting the virtual machine:
-
Azure Activity Logs record the event.
-
The alert rule evaluates the signal.
-
An email notification is sent.
This step reflects real incident testing performed in production environments.
Note: If you delete the virtual machine before the alert rule deploys, the alert rule might not be triggered.
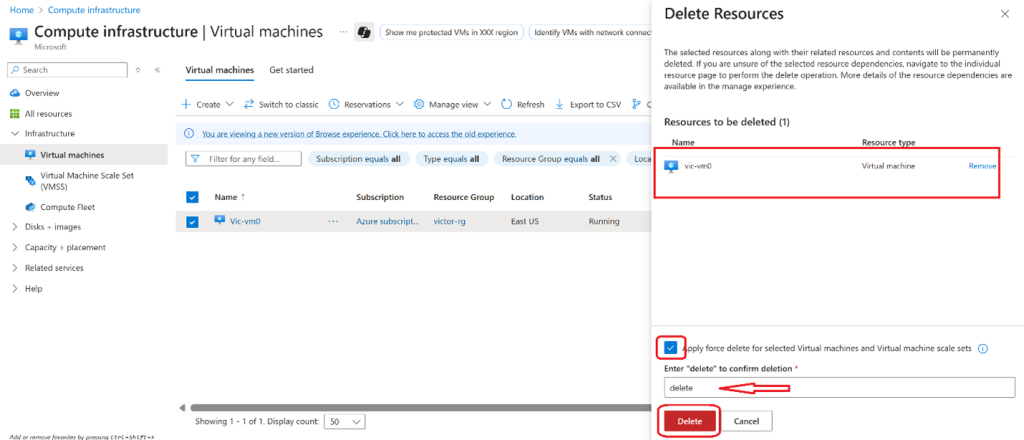
- In the portal, search for and select Virtual machines.
- Check the box for the virtual machine.
- Select Delete from the menu bar.

- Check the box for Apply force delete. Check the box at the bottom confirming that you want the resources to be deleted and select Delete.
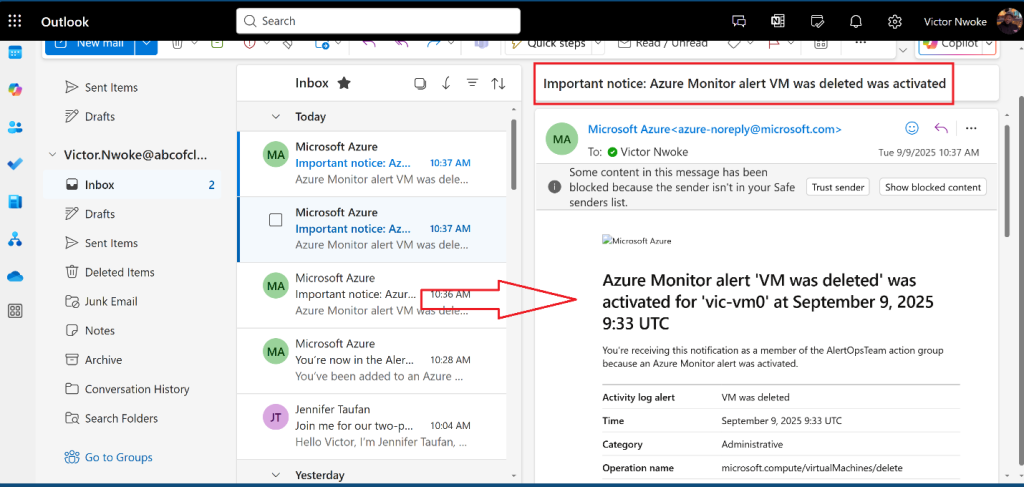
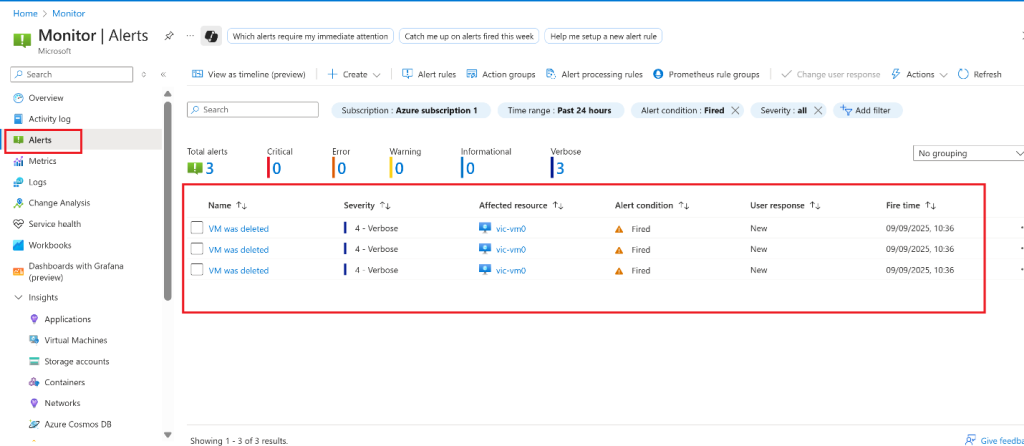
- You should receive a notification email that reads, Important notice: Azure Monitor alert VM was deleted was activated… If not, open your email program and look for an email from azure-noreply@microsoft.com.
- On the Azure portal resource menu, select Monitor, and then select Alerts in the menu on the left.
- You should have three verbose alerts that were generated by deleting
Note: It can take a few minutes for the alert email to be sent and for the alerts to be updated in the portal. If you don’t want to wait, continue to the next task and then return.
Configure an alert processing rule
Not all alerts require action at all times. Alert processing rules allow teams to:
-
Suppress notifications during maintenance windows
-
Scope suppression by subscription, resource group, or alert type
-
Maintain alert visibility while reducing unnecessary notifications
This feature helps prevent alert fatigue, a well-documented operational risk.
You create an alert rule to suppress notifications during a maintenance period.
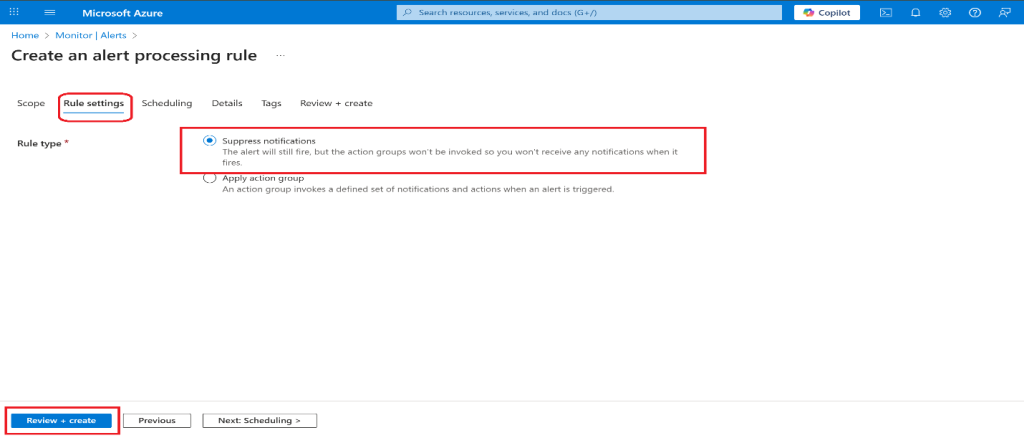
- Continue in the Alerts blade, select Alert processing rules, and then + Create.
- Select your Subscription, then select Apply.

- Select Next: Rule settings, then select Suppress notifications.
- Select Next: Scheduling.
By default, the rule works all the time, unless you disable it or configure a schedule. You are going to define a rule to suppress notifications during overnight maintenance.
- Select Next: Details and enter your settings
- Select Review + Create to validate your input, then select Create.


Real-World Use Cases for Azure Monitor Alerts
In production, these techniques support:
-
Governance and compliance monitoring
-
Incident response workflows
-
Change tracking and auditing
-
Operations team efficiency
Organizations rely on these patterns to reduce downtime and improve system reliability.
Best Practices for Azure Monitor Alerting
Effective alerting strategies follow proven principles:
-
Alert on symptoms, not noise
-
Use meaningful thresholds
-
Route alerts to the right teams
-
Suppress alerts during planned maintenance
These practices are recommended by Microsoft’s Cloud Adoption Framework.
Conclusion
This hands-on guide demonstrates how Azure Monitor can be used to detect critical infrastructure changes, notify stakeholders, and reduce alert noise through processing rules. Applying these techniques helps organizations maintain visibility while keeping operations manageable.